
Walk into most maintenance offices and you’ll see a colourful dashboard on the wall, full of charts and KPIs. In theory, these should be the heart of data-driven maintenance. In reality, they’re often ignored or openly distrusted. When someone points at a dip in uptime or a spike in downtime, the first reaction is usually: “Where did that number come from?” That distrust undermines decisions and stalls investment. This article explains why dashboards break trust, and what to do about it.
Why dashboards lose credibility (quick recap)
Trust erodes slowly. The usual culprits:
- Inconsistent logging: Different technicians enter different text for the same work (e.g., “pump serviced” vs “pump replaced”), so counts and categories don’t add up.
- Late or batched updates: Jobs closed days later with approximate durations ruin time-based metrics.
- Manual “fixes”: Export → edit → re-import workflows are obvious to users and demolish trust.
- Overloaded visuals: Too many KPIs or confusing charts mean people stop reading dashboards.
- Missing provenance: If users cannot click a KPI to see the originating work order, they don’t believe it.
The cost of untrusted dashboards
Untrusted dashboards cause real damage: wasted investments (fix the wrong things), hidden recurring problems, demotivated teams, and leadership that won’t fund improvements. In short: dashboards that lie are worse than no dashboards at all.
The foundation: data hygiene and governance
Fixing dashboards starts with the basics.
1. Standardise how work is logged
- Create a small controlled vocabulary for common actions (e.g., “replace”, “inspect”, “lubricate”).
- Use preset failure codes instead of free-text descriptions.
- Make crucial fields mandatory: asset ID, fault code, start time, end time, parts used.
2. Enforce timeliness
- Require job start/finish timestamps at the point of work (mobile entry).
- Discourage batch-closing of tickets — audit and flag delayed closes.
3. Prove provenance
- Make each KPI drillable: clicking uptime should open the source asset and related work orders.
- Require photos or notes for critical failures.
4. Keep dashboards simple
- Limit dashboards to 5–7 high-impact KPIs (e.g., MTTR, FTFR, uptime %, backlog, PM compliance).
- Add role-specific views (operator vs maintenance manager vs director).
Technical enablers (what to deploy)
A reliable dashboard depends on a few pragmatic pieces of tech — nothing futuristic:
- Mobile data capture so technicians log work at the asset.
- Mandatory fields & structured forms (reduce free-text).
- Attachments (photos, manual references) linked to the work order.
- Searchable asset history (so “why did pump X stop?” points to past fixes).
- Scheduled / exportable reports for leadership packs (PDF/CSV).
Note: integrations to ERP/inventory are useful but optional — start with a clean single source of truth in your CMMS and export as needed.
How to roll this out — a practical 60-day roadmap
Week 0–2: Audit & rules
- Audit current data sources and top 10 data problems.
- Agree definitions for 5 key KPIs.
Week 3–4: Fix forms - Build mobile forms with mandatory fields for critical job types.
- Add a “photo required” flag for safety / root-cause tasks.
Week 5–8: Pilot - Run pilot on one production line or asset family. Collect baseline KPIs.
Week 9–12: Scale - Roll out to other lines, train teams, and publish the trusted dashboard to the site.
Measure & iterate: MTTR, FTFR, time-to-close, PM compliance, and data lag.
Talk to leaders in their language (build the ROI)
To persuade leadership, translate improvements into money and risk:
- Hours saved in monthly reporting = (£ / hour × hours saved × 12)
- Reduced unplanned downtime = lost revenue per hour × hours saved
- Faster approvals for budget when dashboards are trusted
Give two quick numbers in your board pack: current MTTR & target MTTR, current reporting hours per month & projected hours after change.
How Makula CMMS helps make dashboards trustworthy
Put simply, the platform turns your CMMS from a data silo into the single source of truth your dashboard needs. It focuses on time-based PMs and structured work orders so the numbers you see come from consistent, auditable records, not guesswork.
What the platform delivers:
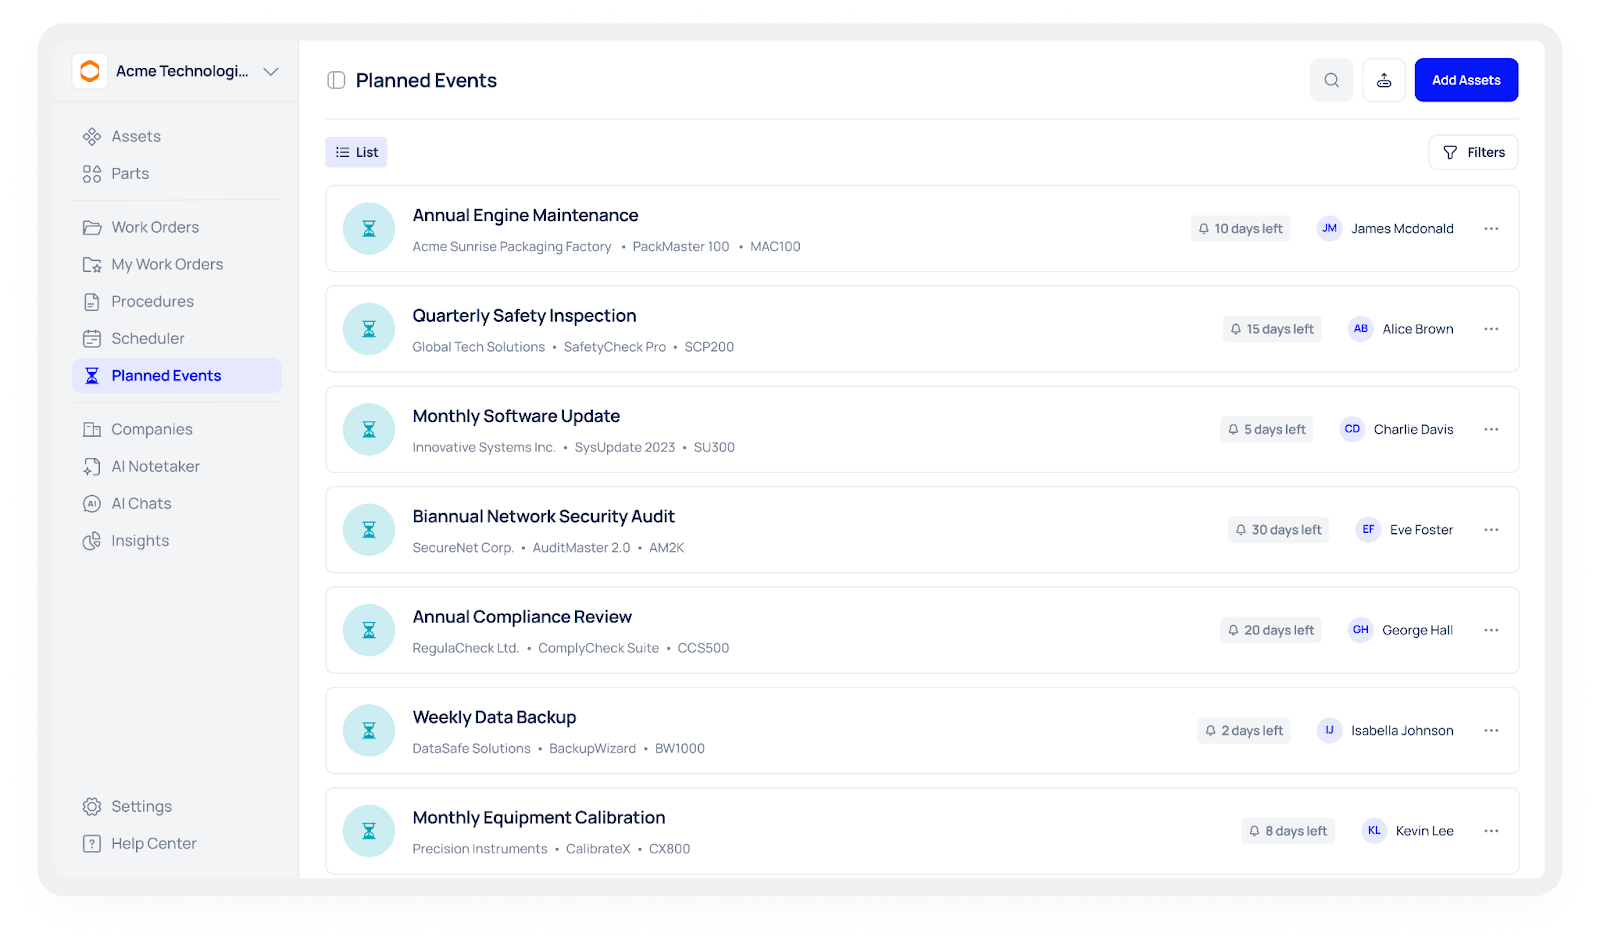
- Time-based PM scheduling & reminders — schedule recurring PMs and record every completed run so PM compliance feeds your uptime and backlog KPIs.
- Mobile-first digital checklists with mandatory fields and photo attachments — technicians log work at the asset, reducing late/batched closes and free-text variance.
- Asset-centric records — manuals, SOPs, parts lists and past work orders are attached to the asset so every KPI can link back to source evidence.
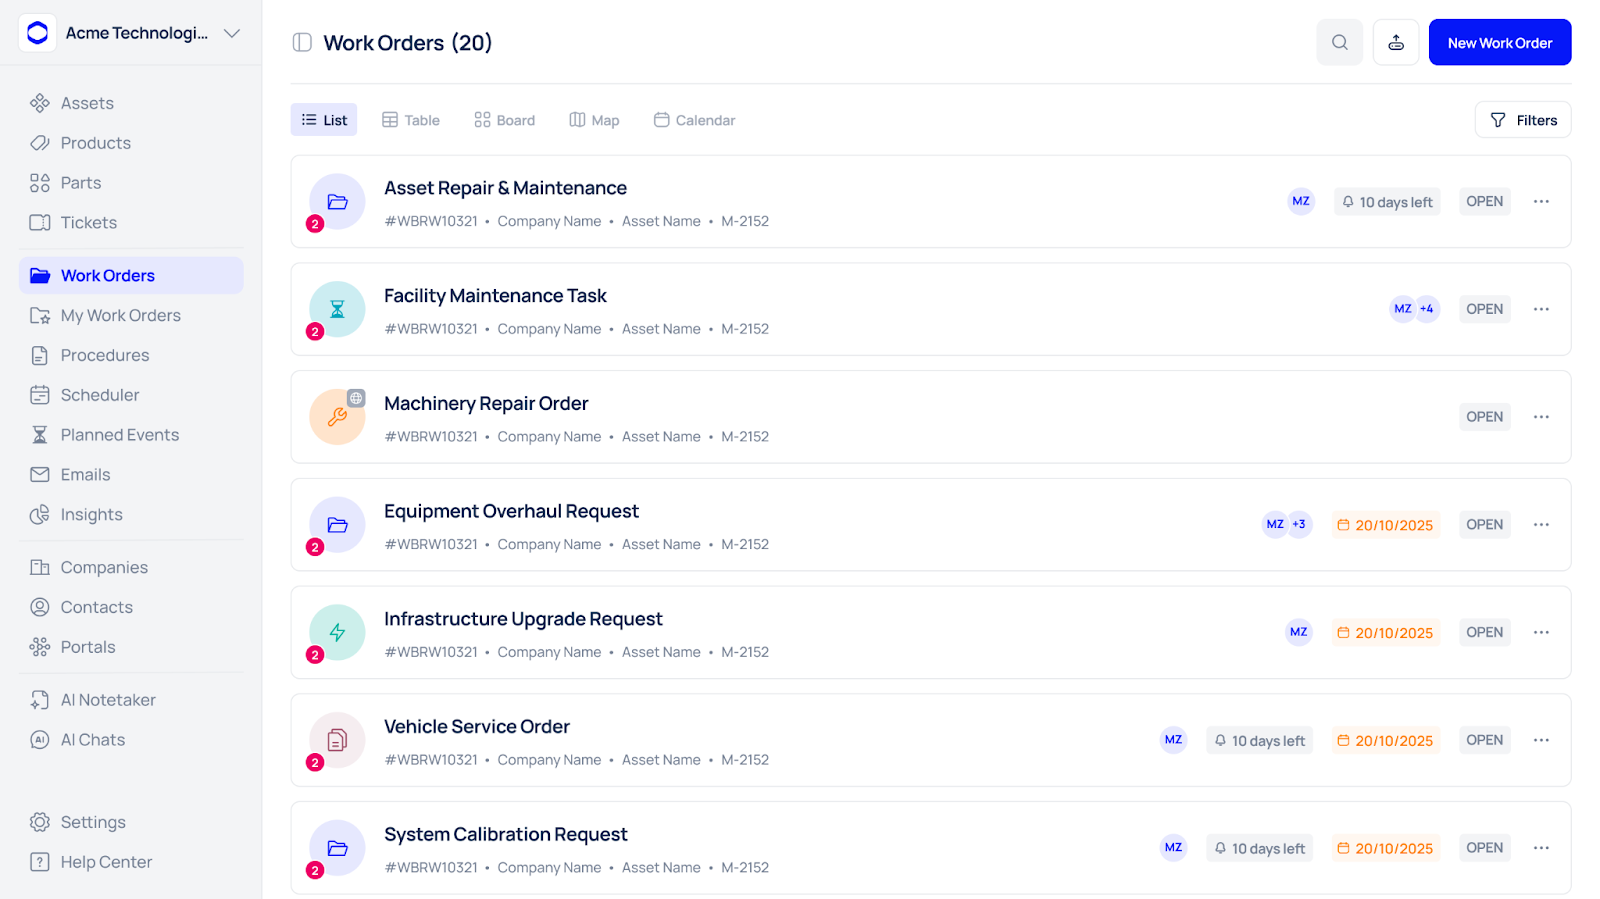
- Timestamped work orders & sign-offs — who started/finished and when is captured, so elapsed times (MTTR inputs) are defensible.
- Searchable repair history — surface “golden fixes” and evidence for drill-downs instead of relying on memory.
- Exportable reports & dashboard sources — generate leadership packs (PDF/CSV) from the same data that drives operational dashboards.
- Access controls & audit trail — role-based viewing and a clear audit trail protect data integrity and help with compliance.
How this changes dashboard trust (quick):
- Dashboards show metrics derived from standardised, timestamped work orders — stakeholders can click to prove a KPI by opening the underlying record.
- Fewer manual edits and batch closes mean fewer surprises and less “Excel fiddling.”
- Cleaner inputs (mandatory fields, photos) reduce noise and make trend analysis meaningful.