An unexpected breakdown brings a familiar kind of chaos: alarms sound, production stops, and the pressure mounts to get things moving again. The team fixes the problem, everyone breathes a sigh of relief, and business returns to normal. But what is the true financial impact of that "normal" interruption?
Many businesses can see the cost of a replacement part on an invoice, but the wider financial damage is often hidden. When you can’t calculate the real cost of breakdowns, you’re navigating blind. Understanding the full cost of unplanned downtime is the first step toward controlling it.
More than just a broken part
The direct cost of repairing a motor or replacing a bearing is only the tip of the iceberg. The true financial impact spreads across your operation and includes both tangible and intangible costs.
Tangible and intangible cost categories (summary):
- Direct costs: Labour (including overtime), replacement parts, external contractor fees, expedited shipping. These are immediate and obvious.
- Lost production costs: Revenue lost while the machine is offline — every minute a machine sits idle is lost value.
- Secondary costs: Idle operators, knock-on effects on downstream processes, late-delivery penalties, and overtime to catch up.
- Intangible costs: Customer dissatisfaction, damaged reputation, lower employee morale, and increased safety risk — hard to measure, but real.
Why most organisations undercount downtime
The reason many businesses fail to track the cost of unplanned downtime is that the information is scattered instead of being captured inside a centralised asset tracking system that connects maintenance, operations, and finance data. The finance department sees the invoices for parts, the operations manager sees the dip in production, and the sales team deals with unhappy customers, but without unified digital maintenance records, the complete picture is never clear. Without a unified view, the complete picture is never clear.
For example: a failed conveyor might cost £500 in parts and labour. But if it halts production for two hours and each hour of production would have generated £2,500 in revenue, you’ve lost £5,000 in addition to repair costs. Add idle operator wages and potential late-delivery penalties, and the real cost can quickly multiply.
From mystery to measurement
You cannot manage what you do not measure. Calculating unplanned downtime moves the problem from vague and unavoidable to specific and actionable. Once you have a credible cost-per-event figure, you can justify investments in improved preventive maintenance, staffing changes, spare-parts strategy, or better scheduling.
A centralised, time-based CMMS helps make the invisible visible by storing work orders, repair costs, downtime timestamps, and technician notes in one place, enabling clearer cross-team reporting and simpler cost calculations.
Tip: If you don’t have fully integrated systems, gather the minimum fields from finance, operations, and maintenance (repair invoice, downtime start/end, affected production rate) and calculate a conservative estimate. Even rough numbers are far better than none.
Simple breakdown-cost calculator (concept)
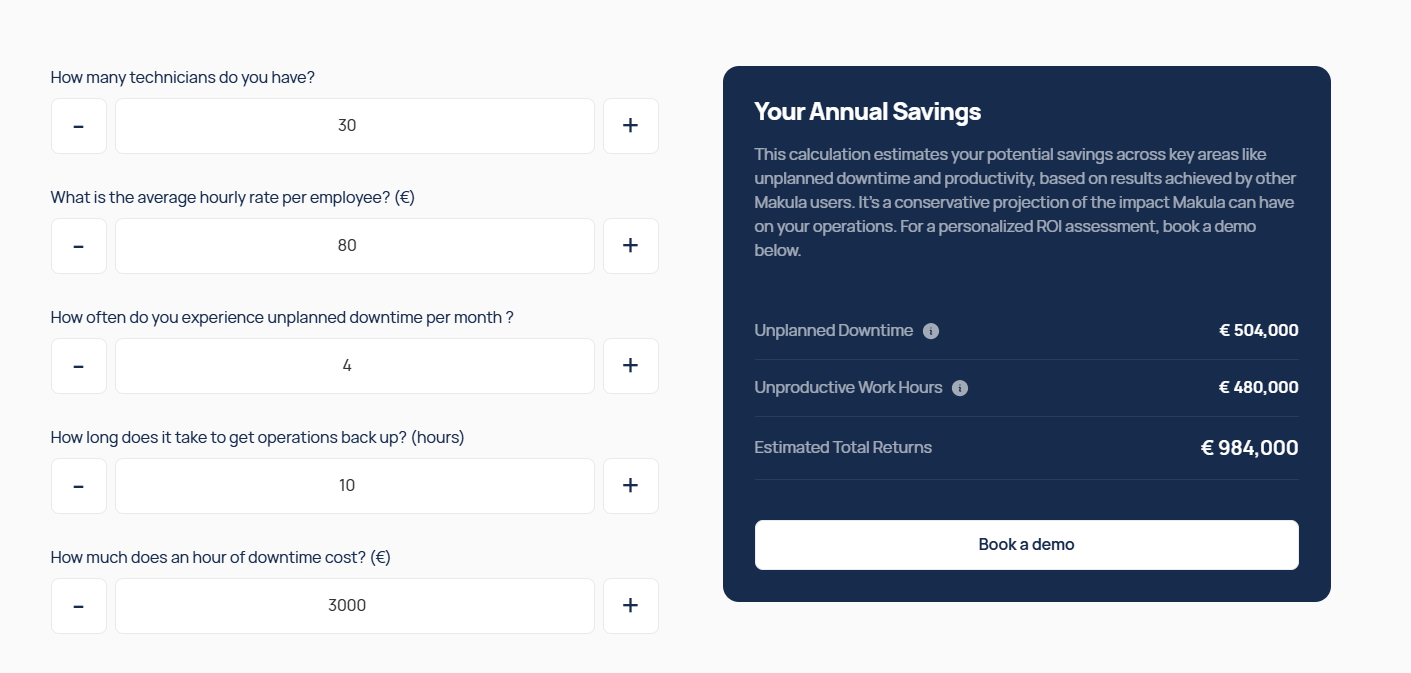
Purpose: Provide a fast, high-level estimate of the financial impact of a single downtime event. Use it to prioritise investments and to build a business case for PM improvements.
User inputs (minimum):
- Downtime duration (hours) — how long the machine was down.
- Lost revenue per hour (£) — revenue or profit lost per hour of production. (Tip: average daily revenue ÷ operating hours.)
- Number of affected employees — staff idle due to the breakdown.
- Average employee hourly rate (£) — wage cost for affected employees.
- Repair costs (£) — parts, contractors, and expedited shipping.
Calculation logic (simple):Total Cost = (Downtime Duration × Lost Revenue Per Hour) + (Downtime Duration × Number of Affected Employees × Average Employee Hourly Rate) + Repair Costs
Output example text:
“Estimated cost of this breakdown: £[Total Cost]. Note: this figure includes direct, production, and labour costs but does not include intangible impacts like customer reputation or regulatory fines.”
Practical steps to reduce the real cost of breakdowns
- Record downtime consistently. Capture start/end times, root cause, and repair cost in your CMMS or a standard incident log.
- Centralise cost inputs. Ensure finance, ops, and maintenance systems feed a common record so you can calculate total cost per event.
- Use the cost metric to prioritise. Focus preventive work on assets with the highest downtime cost, not just the most failures.
- Improve spare parts and vendor SLAs. Faster access to parts and reliable vendor response reduce repair time and cost.
- Run targeted PM pilots. For high-cost assets, test increased PM frequency or focused inspection tasks and track whether downtime or cost falls.
- Measure ROI. Compare the cost of additional preventive work (labour, parts) to the avoided downtime cost to prove value.
- Communicate metrics to leadership. Translate downtime into clear financial impact so leadership understands the case for investment.
Ready to measure? Start small
You don’t need perfect data to begin. Use a simple calculator to estimate cost per breakdown, then track trends over time. Even conservative estimates will highlight where unplanned downtime hides the largest financial leaks — and where preventive work will deliver the biggest returns.
If you’re using a time-based CMMS, ensure that every work order includes downtime timestamps and repair cost fields so you can run monthly or quarterly reports on cost-per-event and trend them across asset groups.